.svg)


If you’re a marketer, your day-to-day probably consists of transforming hard-to-read data scattered over many advertising channels and platforms into summarized, organized reports that provide actionable insights for your business. We know how critical this information is, so what if there was a more intuitive, less time-consuming way of getting the same results? Introducing Adriel’s exciting key feature: Pivot Tables.
To get a deeper understanding of the performance of your marketing efforts, efficiently organizing your advertising data is key, and this is where Adriel’s pivot tables truly make a difference. Adriel’s highly customizable platform allows you to shape your digital workspace in alignment with your business’s objectives and prioritize the data that matters most. These features prove to be extremely useful especially when running a very large number of campaigns from multiple ad accounts or managing multiple brands and businesses for yourself or on behalf of your clients if you’re a digital advertising agency.
Adriel’s pivot tables are a tool that lets you cross-evaluate channels, campaigns, and more through your selection of KPIs, so that you can find the best performing campaigns according to your specific set of goals, and benchmark campaign features and settings to maximize your ROAS. With Adriel, you can create pivot tables directly from the dashboard and compare performance results in an unprecedented efficient manner.

Let’s dive a little deeper into how pivot tables work: The pivot tables use customizable rows that act as folders to group campaigns into your selection of categories. According to your needs, you can create rows that categorize campaigns into groups such as product, project, marketing channel, ad creative, target audience, and many more! There is no limit. Do you need to rearrange your pivot table with different criteria? Easy: Simply add rows or edit their order. And of course, the table’s columns are customizable as well: sort them to your preference to evaluate and compare campaign performance even further.
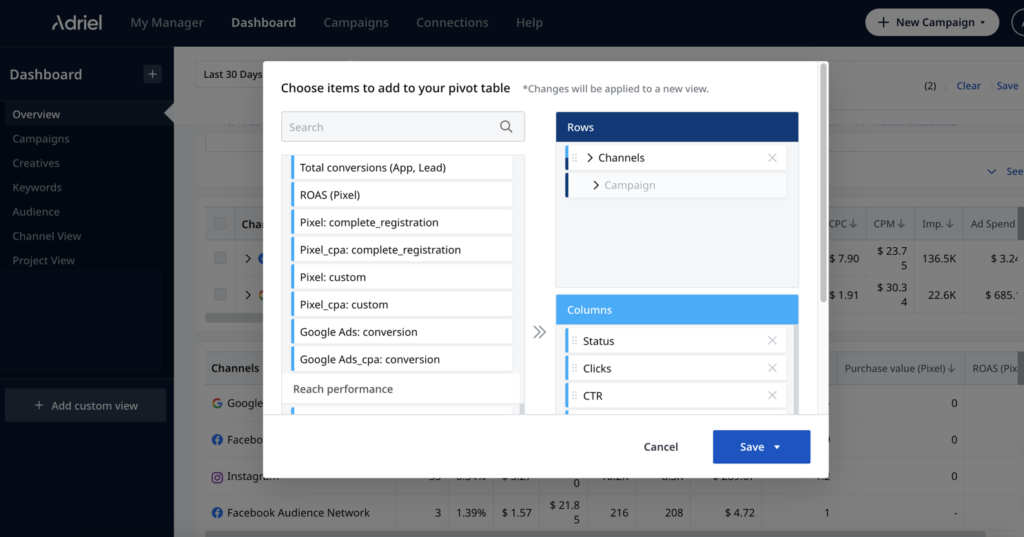
Once your precious data is highlighted to your preference, make sure to save your pivot tables as presets so that you’re able to use them later and share them with your team.
Understanding each campaign, channel, and ad creative’s attribution and how each of them leads to sales and conversions is key to accurately allocating your advertising budget and reaching your business goals. But navigating endless amounts of data to find answers can sometimes be counter-productive.
Adriel’s pivot tables offer a solution by allowing you to access and highlight the information that matters most to your business in a simple, intuitive way. Discover the true status of your paid advertising and find out which of your marketing campaigns are the real difference-makers for your business.
Book a call with a product specialist today!


_220804.png)

.png)